The Foreword to the new book “The Wisdom of Our Ancestors: Conservative Humanism and the Western Tradition.”
The Global Warming Conundrum
June 4, 2015
This essay appears in the Winter–Fall 2012 issue of Modern Age. To subscribe now, go here.
Global warming, or climate change, has become a highly contentious issue, with political, economic, social, ecological, and scientific implications. The hapless observer is bombarded with books and documentaries replete with apocalyptic images, likely to be familiar from Al Gore’s An Inconvenient Truth and Earth in the Balance as well as writings by James Hansen and other climate action activists, portraying a world overcome with famine, flooding, and destruction.1 Meanwhile others denounce the whole global warming theory as a cruel hoax that will itself condemn many to lives of deprivation and starvation. Unfortunately, such issues drive partisans to employ divisive rhetoric and obfuscating arguments, with the result that it can be difficult for an objective observer—who simply wants to understand the issues at stake—to make a reasoned judgment. Global warming, in fact, has to some degree displaced evolution as the subject where public disagreement over science has turned into politicized controversy. Global warming is different, however, in that there are many more reputable scientists who publicly question the supposed scientific consensus on it than is the case with evolution.
The purpose of this essay is to sort out the issues and present each in as objective a manner as possible, exploring the pros and cons of both sides, and also to examine the main reasons for the controversy. The goal is to give the interested reader enough understanding of the problem to be able to hear and evaluate properly arguments, evidence, and conclusions, and thus to make intelligent judgments about matters relating to global warming and climate change. The unfortunate politicization of science, so evident in this controversy, should also become apparent to the reader. By taking a sufficiently long view of climate change, the reader can gain a valuable perspective on the controversy. It will become apparent that the current arguments about the well-publicized “hockey stick” temperature graph are really a sideshow to the important issues.
Overview of the Controversy
The controversy is not merely about changes in the earth’s climate, because we know from historical records and paleoclimatology research that the earth’s climate has always been changing. Rather, the current controversy is about the effect of human activity on the earth’s climate, and in particular whether human activity is causing the earth’s climate to warm significantly. By significantly we mean enough to cause potentially serious, deleterious, and widespread changes to geography, flora, and fauna. This is known as “anthropogenic global warming” (AGW).
The concern about global warming arose because of temperature measurements made over recent decades that suggest a relatively rapid rate of warming. Climate change research, indeed, has two directions: looking back at past climate trends, primarily temperature, and looking forward to possible changes in the future. Past temperature trends are reconstructed from proxy data until the late nineteenth century, when reliable instrument-based temperature measurements began to be recorded. For the future, computer-based climate simulation models, known as “General Circulation Models,” or GCMs, are preferentially employed to project the effect of various types and degrees of climate change, based on recent trends and assumptions about climate-related matters.
If the more pessimistic warming predictions are true, the inference usually drawn is that action on a global scale is required to mitigate that warming so as to avoid these undesirable changes, which include widespread coastal flooding, extinctions, and possibly famine. The action envisioned usually involves significant reduction in the use of carbon-based fuels, since the warming is generally attributed to excess carbon dioxide emissions, which come about from the burning of these fuels. Obviously, any program to accomplish this goal would involve coercive measures on a very large scale and many significant remediation expenses and efforts, as well as disruptions in individual ways of living, social organization, business practices, and other areas. On the other hand, taking action when none is warranted will inevitably condemn many—especially the poor—to lives of unnecessary deprivation and possibly starvation.
The term global warming can refer (1) to the recent sharp rise in global temperatures, or (2) to the explanation of it most commonly given, namely, human activity and specifically the production of large amounts of carbon dioxide released into the atmosphere. A fact and its explanation are always separate, and one can accept the first but reject the second. In today’s politically charged environment, however, this is often ignored; those who reject the anthropogenic explanation are labeled “climate deniers” and equated with “Holocaust deniers” and yahoos who claim gravity is a hoax.2 The fact of the temperature rise and its explanation are often purposely conflated on account of a perceived need for political action; in this way one can use the veracity of the first to justify the second, and so silence critics without the need to address their arguments.
For the sake of clarity, we shall list those matters not in dispute, followed by those that are in dispute.* First, points not in dispute and not rejected by the “climate deniers”:
- The recent rise in global temperatures, since about 1980, which is well attested by both ground-based and satellite measurements
- Increased carbon dioxide levels in the atmosphere, from 290 parts per million (ppm) in 1900 to more than 390 ppm in 2012 (though CO2 is less than 0.1% of the atmosphere by volume)3
- Human activity as the principal source of the increase in CO2 and other greenhouse gases
- Carbon dioxide and other greenhouse gases as climate “forcing functions,” which cause heating of the atmosphere**
- Feedback loops in the climate system that can amplify or diminish climate forcing
What is in dispute is the explanation for the recent rise in temperature, involving these factors:
- The temperature record over the past one thousand years
- The nature of the feedback loops in the climate system (resulting in amplification or diminution)
- The impact of factors other than greenhouse gases on the atmosphere
- The overall dynamics of the climate system
- The degree of natural variability in the climate system
Effectively, those who support the AGW hypothesis believe that the dynamics of the climate system are such that they amplify the greenhouse gas effect, causing an increased rate of warming; those who reject it believe that the dynamics cause the greenhouse gas effect to be diminished, and possibly outweighed by other factors, resulting in little or no new warming. Unquestionably, however, the fact of the recent warming requires some sort of explanation, regardless of whether one agrees with the prevailing opinion that it is ultimately caused by human activity.
In this problem as in many others, it is useful to be aware of the orders of magnitude involved. So for reference, the earth’s current level of CO2 is usually rated at 1.5 watts/square meter of forcing, methane at 0.5 watts/square meter, and all greenhouse gases together at about 2.4 watts/square meter. Solar irradiance (energy from the sun) is on the order of 1,368 watts/square meter at the top of the earth’s atmosphere when the sun is overhead. Taking into account the lower angle of the sun in most locations, reflection by the atmosphere, the absence of sun at night, and other factors, the amount of solar energy actually incident on the earth’s surface averages about 240 watts/square meter. This means that greenhouse gases are about 1% of the sun with respect to forcing. If there were no amplification or diminution of the effect of the greenhouse gases, a doubling of them (expected over the next fifty to one hundred years) would raise the earth’s temperature by about 1oC. As we shall see, forecasts are for increases about three times higher than this.
The organization primarily responsible for coordinating and collecting research on climate change, and formulating policies, is the United Nations Intergovernmental Panel on Climate Change (IPCC), established in 1988. Its mission is to “provide the governments of the world with a clear scientific view of what is happening to the world’s climate.”4 It has issued four major reports, called “assessments,” and is preparing a fifth. The IPCC assessments are quite detailed and represent contributions from climate scientists worldwide; they are clearly the product of an enormous amount of research and data collection. The IPCC assessments are intended to synthesize the best knowledge we have about the earth’s climate and to make judgments accordingly. For this reason the assessments are often taken, not without justification, as the final word on the subject. The IPCC’s general position is that naturally driven climate change occurs over relatively short periods; a sustained temperature rise lasting thirty years is unprecedented and therefore must be the result of a nonnatural forcing function. The IPCC does not publish dissenting views, despite acknowledged uncertainties in climate science and the brevity of the instrumented climate record.
With this background in mind, we can itemize the questions that must be answered:
- Has there been significant warming in the recent time period (fifty years, one hundred years, etc.)?
- Is this trend unusual in context of historical global temperatures (tens, hundreds of thousands of years)? That is, does it represent an anomaly?
- How good are the data on which predictions (pro and con) are based?
- What are the known or suspected correlations with temperature change (solar activity, human activity, etc.)?
- What are the best available projections of future changes, and how reliable are they?
- What percent of recent warming can reasonably be attributed to human activity?
- How much of this human activity is associated with use of carbon-based fuels?
- What realistically can be done to curb this activity?
These questions are not entirely independent, of course, but it is convenient to consider them separately, as they are often conflated in the raucous argumentation about global warming and climate change. At this point we can also perceive the reasons why the controversy has become so acrimonious:
- Remediation costs could be extremely high, meaning that there are political/economic issues that potentially overshadow scientific concerns.
- Costs/benefits may be unevenly distributed. Benefits may accrue to some individuals, industries, or countries, whereas there could be high costs for others, often with few or no direct benefits.
- Dire predictions cause the controversy to assume a quasi-religious nature, since some are genuinely convinced that global warming is a threat to the planet and humanity.
- GCMs are still evolving and subject to dispute, especially about causal influence and drivers. Thus the magnitude and timing of effects of climate change are very uncertain.
- Comprehensive measured data are only available for a relatively short period (a few decades), compared to the known time constants for climate change.
- Reputations of individuals and organizations are now staked on one position or another, making any concessions potentially embarrassing and career wrecking.
Money is the primary driver of much of the controversy surrounding global warming. If remediation costs and concomitant changes in the way we live were small, there would be little or no objection to any mitigation program, if for no other reason than as an “insurance policy.” No one wants to take unnecessary chances with Mother Nature. But the higher the potential cost for remediation, the greater the certainty needed, at least with respect to political action. No elected politician will impose onerous new laws or taxes without something close to irrefutable evidence; and even then, a crisis sometimes must be imminent or already upon us. And few if any businesses will voluntarily assume a large cost burden in the absence of compelling reasons and, in most cases, some guarantee that other businesses are required to do the same.
It is, in fact, the economics of global warming more than anything else that has led to the politicization of what should be a strictly scientific question. This is most unfortunate, because it obscures the fact that disagreements are common in science and, indeed, are one of its most valuable drivers. The process of working out theoretical differences commonly involves data gathering and experimentation to determine which theory is correct. This process requires that all participants have an open mind and not cling to their theories for extra-scientific reasons; it also requires honesty, forthrightness, and completeness in documenting findings and methodologies. Otherwise the whole scientific process breaks down. Scientists are human and can also lose sight of their responsibilities, owing to ideology, money, prestige, political pressure, or simply ego.
* There are irrational people on both sides of the climate debate, of course, people who make absurd pronouncements and claims. Here we are concerned with rational people who are sincerely interested in understanding the issues, and fortunately that includes most scientists on both sides.
** “Forcing function” in climatology is something that causes climate changes (warming or cooling), measured in watts/square meter. This refers to the equivalent energy increase from the sun that would be required to achieve the same warming effect.
Greenhouse Effect and Greenhouse Gases
Much of the debate about the explanation of global warming is concerned with the “greenhouse effect” and greenhouse gases, which are atmospheric gases that contribute to the greenhouse effect. The greenhouse effect refers to the fact that many substances—not just glass used in real greenhouses but also gases such as CO2 and water vapor—will transmit light at certain wavelengths but block it at others. Sunlight enters a real greenhouse and warms the objects inside. When the objects inside are heated, they themselves begin to radiate energy by the laws of thermodynamics; but they radiate energy at wavelengths to which glass is opaque. Thus that energy just reflects off the glass and back into the greenhouse. In this way the greenhouse heats up, because most of the energy it receives from the sun remains trapped inside it. (The fact that air cannot circulate between the inside and outside of the greenhouse also contributes to the heating effect.)
The earth’s atmosphere behaves in a similar way, trapping the heat from sunlight. In this case the earth’s surface is heated and then radiates energy outward that is reflected off the atmosphere. This is highly desirable to a certain degree. For example, it prevents the dark side of the earth (the side facing away from the sun at any time) from cooling extremely quickly, as does the dark side of the moon, for instance. Without the greenhouse cases, the earth’s temperature would be on the order of -18oC (0oF); the greenhouse gases raise our average temperature to about +15oC (59oF). With respect to global warming, the question is whether human activity is creating dangerously high levels of these gases, and associated warming, thus triggering potential catastrophic effects.
The gases in the earth’s atmosphere responsible for the greenhouse effect include water vapor, CO2, nitrous oxide, ozone, and methane. Water vapor is by far the most important greenhouse gas, contributing about 75% of the greenhouse effect. But we concentrate on carbon dioxide, which contributes somewhere between 10% and 25%, because we can conceivably control its production—something we cannot realistically do for water vapor. Moreover, this fits with the wider environmentalist agenda of reducing pollutants that result from burning fossil fuels and of reducing consumption of nonrenewable resources. Methane production is 5% to 10% of the total greenhouse gas contribution. It could be reduced by curtailing agriculture or slaughtering livestock, but this (and the resulting mass starvation) is not a politically or ethically viable solution.
Measurement of Warming Trends
There are two basic ways to measure global temperatures: direct and indirect. The direct method simply requires measurement and recording of temperatures across the globe at regular intervals. This is now done with ground-based and precision satellite instruments. The indirect method uses proxies—directly measurable quantities correlated with temperature—when direct measurements cannot be made. Proxies are used primarily to determine temperatures in the past, when modern measurement equipment was not available, or for prehistoric or prehuman times. In theory, direct measurement, and thus the determination of any recent warming or cooling trend, should be a straightforward exercise. After all, we have sophisticated temperature measuring equipment that can be placed practically anywhere, worldwide telecommunications, satellites, computers for recording data, and any other necessary gear. And this equipment has been in place for decades, with many temperature measurements going back centuries. By suitably averaging individual temperatures, a “global” temperature can be determined and used as the basis for trend spotting.
There are three major problems. The first is that of ensuring that any such “global” temperature reconstructions have sufficient inputs from locations all over the globe, and that these are properly weighted and calibrated. Since the extent of temperature change expected is relatively small, accuracy is extremely important. This becomes an issue with measurement stations in areas such as cities where the “heat island” effect can overwhelm the measuring instruments and give a false impression of temperature increase when there is none. In fact, the per-year increase forecast by global warming advocates is quite small indeed: for a 2.0oC change over a century (a fairly large change), the per-year change would, on average, be just 0.020oC—difficult to measure and not detectable from year to year except by precision instruments. So readers are cautioned about taking the latest cold winter or hot summer as a confirmation of any sort of climate change and about commentators claiming that one or even a few years’ hot or cold trend is significant.
The second problem, of course, is how to handle measurements made at different times of day and over different seasons. This must be done in a consistent way, which poses problems when indirect measurements are used. Disagreements over the accuracy and consistency over time of temperature measurements is one of the issues with respect to the scientific basis for warming in recent decades.
The third major problem, and probably the most difficult, is that of correlating historical data from proxies with current, directly measured data. Generally, proxies are such things as tree ring growth, snowfall levels as recorded in ice core samples, rainfall reconstructions, sea sediments, and stalagmites in caves. They can also be historical records and testimony for periods going back hundreds of years, possibly a few thousand. Fortunately, proxies are available quite far back, at least for some parts of the globe; but it can be difficult to calibrate them (i.e., determine the absolute temperature at any given time, rather than just relative temperature changes). There is no way, ultimately, to determine the accuracy of reconstructions based on proxies; although relying on correlations with historical data, we have some reason to think that they give an approximate measure at least. It is also the case that proxies are not usually complete, in the sense of encompassing the entire globe, or the entire time span at a single location. Furthermore, they do not generally permit us to find the temperature for a particular year, but only an average over a span of thirty years or so.
Looking Back: Temperature Trend Analysis
Temperature trends are one major focus of the global warming controversy. For the sake of convenience, temperature trend analysis can be broken into three periods, which reflect different evidence and different measurement methods and models:
- Recent temperatures, roughly one hundred years, for which good instrumented data are available
- Temperature trend since the year AD 1000
- Temperature trends before the year AD 1000, back several hundred thousand years
Though of quite unequal length, these three periods have been chosen because they correspond closely to the degree of controversy surrounding temperature trend measurement. In particular, the first is relatively uncontroversial since it is based on data from modern measuring instruments around the globe. The third is not very controversial since it is based primarily on ice core samples that go back hundreds of thousands of years. Only the second is highly controversial, due in large measure to the now famous “hockey stick” graph, the work of climatologist Michael Mann, first published in 1998.5 This graph purports to show that global temperatures were steady from about AD 1000 until the twentieth century, when they began a sharp uptrend, presumably owing to accelerating human use of carbon-based fuels. Mann’s graph is controversial in part because it does not show either the Medieval Warm Period or the Little Ice Age, both of which are well-documented in historical records. Mann claims that these were, in fact, regional rather than global phenomena.
Recent Temperature Trends
Figure 1, which shows the temperature trend over the past 130 years, from the end of the Little Ice Age (sixteenth to nineteenth centuries) to the present, is from NASA, a reliable source. This is the graph usually cited when evidence of global warming is needed and when action is called for. Not to belabor the obvious, but a few comments on the graph are appropriate. First, note that the temperature anomaly (deviation from assumed normal) is less than 1.0oC over the period. Second, there was an actual decrease from about 1940 to 1975, probably forming the basis for predictions, made at that time, of a new Ice Age. Third, this graph begins at the end of the Little Ice Age, when temperatures were significantly cooler than today, so some degree of warming is to be expected as part of normal climate cycles. A key question—and it is difficult and controversial—is how to remove the effects of this period. And finally, the graph shows some tendency to peak after the year 2000. Nonetheless there is clearly a real warming trend, especially over the past thirty-five years or so. A more detailed graph for the period 1978–2012, based only on precision satellite data covering the entire earth, is shown in Figure 2. This graph illustrates the peaking and the relatively flat temperatures over the past decade.
(http://data.giss.nasa.gov/gistemp/graphs_v3/)
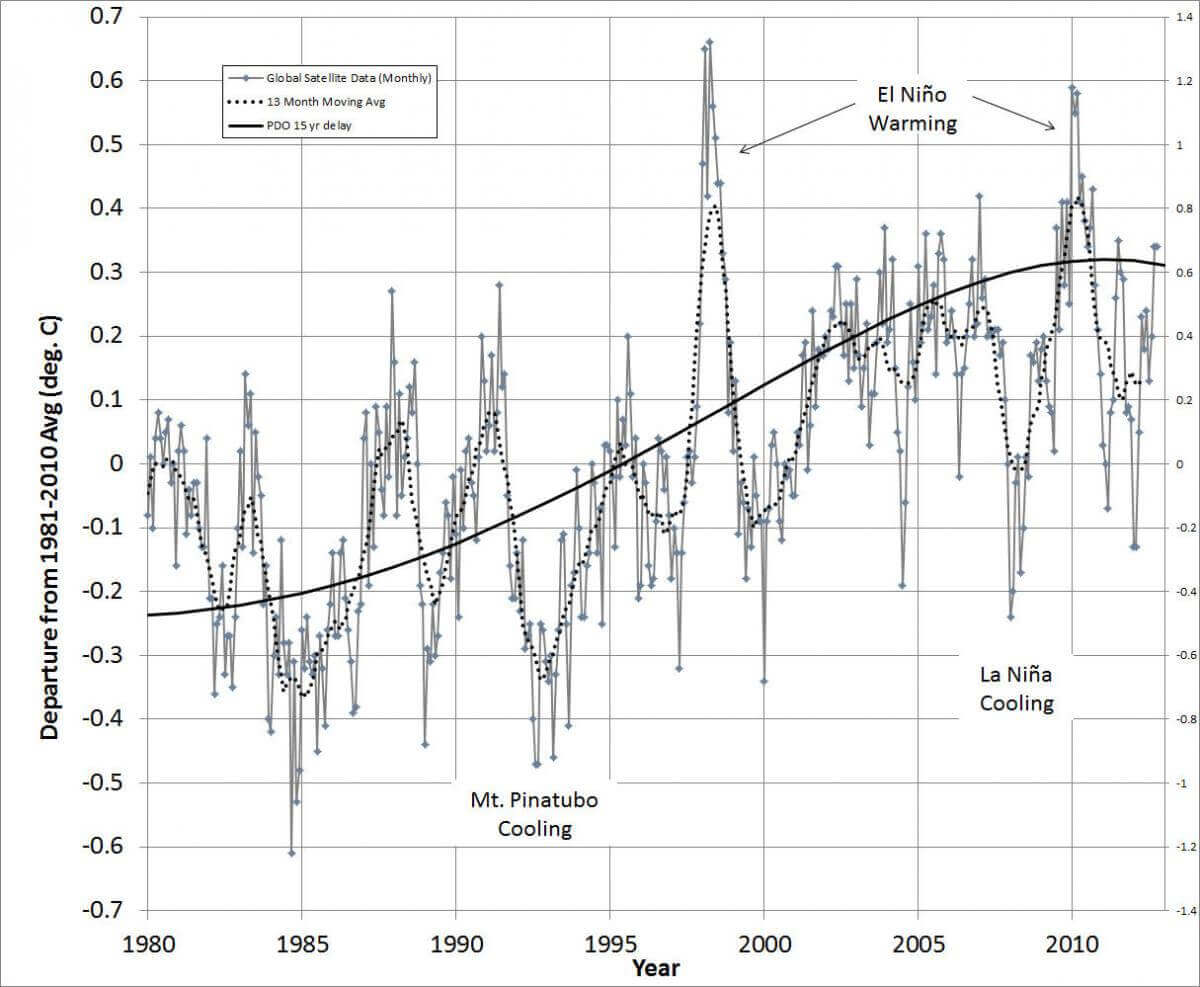
with polynomial regression line added (dashed). Smoothed curve (dots) is
13-month moving average. Source: Roy Spencer/University of Alabama, Huntsville
(http://vortex.nsstc.uah.edu/data/msu/t21t/uahncdc.lt).
The Intermediate Term
Is the temperature rise shown in Figures 1 and 2 unusual or just normal variability? That is the key driver of the global warming controversy—if normal variability, we have nothing to worry about; if abnormal, then possibly catastrophic results could ensue. If an abnormality exists, it is presumed to be due to human action altering the climate. To begin to answer this question, we must examine temperature records going back a millennium. Unfortunately, records become spotty more than two hundred years in the past, and measurements back to the Middle Ages require proxies of various types. This has led to the most heated disputes in the global warming controversy, because it is both directly relevant to the question of contemporary anthropogenic warming and involves disputed methods and data for temperature reconstructions over the past one thousand years. In particular, there is the question of converting proxies such as tree rings to temperature data on a worldwide scale.
This task was undertaken by, among others, Michael Mann, then at the University of Virginia. He sought to gather data from locations worldwide, rather than just Europe and eastern North America. His “hockey stick” results6 achieved a great deal of notoriety. This temperature graph is shown in Figure 3, in the form published by the Intergovernmental Panel on Climate Change (IPCC). Prior to Mann’s work, it was generally accepted that there was a Medieval Warm Period or “Medieval Maximum,” when temperatures were several degrees warmer, on average, than in the preceding half a millennium or so. Evidence for this exists across North America and Europe.7 The Medieval Warm Period was followed, beginning about the year 1500, by the Little Ice Age, which lasted until the late nineteenth century. Both these climate anomalies are well-documented in the European and American historical records. During the warm period, grapes, for example, were grown in England; and the many reports of bitterly cold winters, combined with oil paintings of winter scenes during the Little Ice Age, such as those by Brueghel, clearly show that it was abnormally cold during much of that period.
What Mann sought to demonstrate is that these two anomalies were restricted to Europe, or perhaps Europe and parts of North America, but were not global phenomena. In this way, he believed he could show that global temperatures were fairly steady for about nine hundred years, only to begin a steep rise in the twentieth century. Thus was born the hockey stick, shown in Figure 3. He did this by assembling a large database of temperature record proxies (mainly tree rings) going back one thousand years. These proxies were in the form of tree ring data from various worldwide locations, which spanned parts of the thousand-year period. Mann’s results fit with prevailing concerns about climate, and as a result were widely touted and are still used today as the basis for calls to reduce greenhouse gas emissions. The graph was remarkable because it effectively eliminated the well-known Medieval Warm Period and scarcely showed the Little Ice Age (sixteenth to nineteenth centuries), thus making present-day temperatures appear to be extraordinarily high.
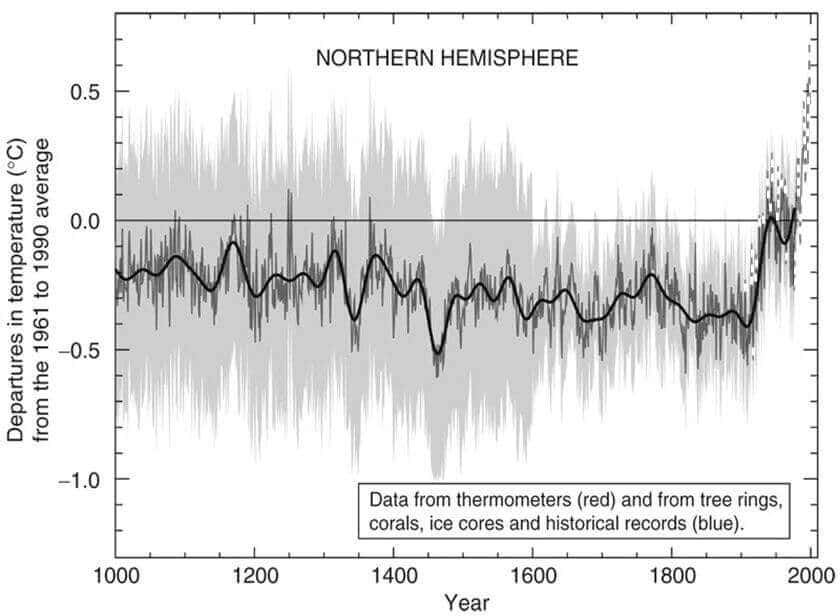
the 20th century. Solid line: smoothed curve. Dark gray line: data from tree rings,
corals, ice cores, and historical records. Dashed line: data from thermometers.
Source: IPCC Third Assessment Report, 2001.
There were, however, doubts on the part of many researchers with respect to the data sets used:
Many tree ring researchers in particular doubted whether the graph had got it right. Initially Mann shared such concerns. . . . Reconstructing past temperatures from proxy data is fraught with danger. Tree ring records, the biggest component of the hockey stick record, sometimes reflect rain or drought rather than temperature. . . . Gordon Jacoby of Columbia University in New York, said: “Mann has a series from central China that we believe is more a moisture signal than a temperature signal. . . . He included it because he had a gap. That was a mistake and it made tree-ring people angry.” A large data set he used from bristlecone pines in the American west has attracted similar concern.8
Tree ring data is suspect because examination of tree rings from the late twentieth century has shown that they do not, in fact, demonstrate sensitivity to the unusual warmth during that period. If this is true generally, it would entail that the tree rings underestimate warming in the past, and temperature reconstructions based on them would thus show less variation than actually existed, especially on the high side—precisely what the hockey stick shows.9
There is another, perhaps more serious problem. When confronted with large amounts of data, much of which is “noisy,” assumptions need to be made about how to combine the data into one meaningful picture. In this case, that picture is a graph of worldwide average temperatures. In particular, one has to decide how much weight to put on each data set, and how to fill in gaps in the data, or in some cases whether to extrapolate it. This involves building a statistical model that allows one to combine the data into a coherent whole. Now, modeling is a well-respected tool in modern science, since it allows scientists to explore and reconstruct phenomena in ways that are impractical or impossible through direct observational methods. But any modeling technique must be robust in the sense that small changes to its data set should not cause large changes in modeled behavior. This is especially important in cases such as global warming, where there is considerable uncertainty in past reconstructions of temperature. In fact, insertion or deletion of one or a few data elements (such as temperatures from a particular location) should have only a small effect on the model output. Otherwise there can be little confidence in the model, because future data set changes from better measurements or more accurate reconstructions from proxies could then result in a completely different model output. A danger in any sort of modeling and reconstruction exercise such as this is that the researchers will cherry-pick the data to get their desired result. Consequently, an honest presentation requires openness and a willingness to share data and methodology.
In theory, it should not be so difficult to resolve the question of the temperature record from a scientific standpoint. Given the importance of the question of global warming, there should be a large international, publicly available data base to which new data, as they become available from suitable sources, are added. Then any researcher who wishes to reconstruct past temperatures could do so and, by publishing his methodology and indicating how and why he selected and weighted his data, thus make a contribution to the field. Science works on the basis of reproducibility: any scientist who claims to have achieved a result must disclose his method, materials, and data sources so that others can reconstruct what he did for verification. Whether the scientist did an experiment in a lab or analyzed data to reconstruct past events (common in astronomy, geology, and cosmology as well as climatology) makes no difference. Reproducibility ensures that no one cheats—something, even in science, humans are prone to do, especially given the modern-day pressures to achieve results and get grants. Constant questioning of results is the lifeblood of science because it keeps everybody honest.
It is therefore troubling that Michael Mann’s famous hockey stick graph was not immediately scrutinized by climate scientists worldwide. Those who favor the idea of anthropogenic global warming must surely have been aware that a well-documented and consistently duplicated result would have been a much more potent weapon than a poorly documented result that could not be easily duplicated. Alas, that verification and duplication did not happen; Mann’s result was shouted to the heavens, but no one wanted to see if it was really valid. Mann did eventually make his data sources public but not his methodology. He finally released his code when asked to do so by Congress, but what was released was, and remains, incomplete.10
As it happens, the first person who attempted to verify Mann’s work, and replicate his data analysis and results, quickly discovered that it was not a straightforward process and that Mann himself had little interest in enabling this crucial scientific step. He also discovered that it was not very robust with respect to data sets, thus calling into question its value. This action led to a review by the National Academy of Sciences, which determined that the graph was in fact the result of flawed methodology.11 A subsequent version of the graph had the Medieval Warm Period reappearing, along with the Little Ice Age.
Prior to that, however, the graph was adopted by IPCC for its Third Assessment Report (2001) and became widely circulated. This gave clear evidence that the warming of the late twentieth century was unprecedented, and quickly led to calls for political action. But in 2009 the “Climategate” scandal broke. This incident involved the unplanned release of e-mails among various climate researchers, including those involved with the hockey stick graph. The e-mails made it appear, at least, that the climate scientists were more concerned with a political agenda than with objective science, and in fact were trying to suppress views that contradicted their own.12
The net result of this incident was a significant increase in the skepticism already surrounding the claims for anthropogenic global warming. It became clear that despite claims of “consensus” and “settled science”—something essential if coordinated worldwide abatement efforts are to gain traction—the matter of explanation of the recent temperature rise is still far from being resolved. And it also appears that we will need at least twenty more years of data to be able to state with any confidence whether the pause in warming since 2001 is temporary or indeed represents some sort of top. At this point, the IPCC appears to be backing away from the hockey stick as the primary impetus to action (although it still supports the basic finding of unprecedented warmth in the twentieth century);13 instead, the focus is now on other aspects of their scientific case, primarily the mechanisms believed responsible, mechanisms that operate regardless of whether the hockey stick is true.
Longer-Term Findings
Perhaps the best way to put the current global warming controversy into perspective is to look at temperature records over longer historical periods. These records are obtained by proxies, and the main proxy used is ice core samples from central Greenland, made by NOAA. These are shown in Figure 4, beginning with the period from AD 1400 to the present, illustrating the controversial “hockey stick”:
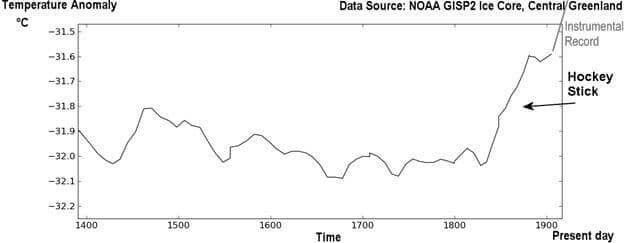
with recent instrumental record added
It appears that things may be getting pretty bad today. But let us move to a slightly longer term, going back to the year 800, illustrated in Figure 5:
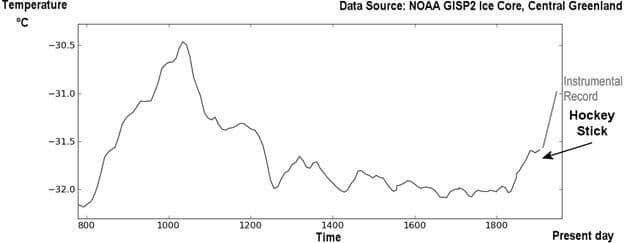
with recent instrumental record added
Now things start to become more interesting. The well-documented Medieval Maximum is clearly visible and shows a much higher temperature deviation than the modern record. (This is disputed by some climate researchers and by the IPCC, which claims that its top is below that of the modern instrument record.)*** Nonetheless the ice core data agree with documentation that grapes were grown in England, for example, during that period. It was also a period of great awakening in Europe.
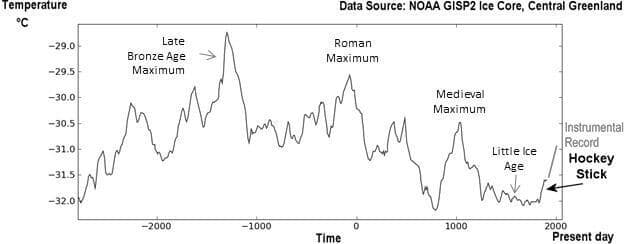
But we must look further back, so we turn to the period from about 3000 BC to the present, given in Figure 6. Now more trends become apparent. In particular, there is a peak corresponding to the Roman Empire, well documented, around the year 50 BC or so, known as the “Roman Maximum,” which dwarfs the Medieval Maximum; and an even larger peak at the time of the late Bronze Age, about 1200 BC, which in turn dwarfs even the Roman Maximum. The late Bronze Age was also a very fertile period for human activity. There is also a smaller peak during the period now usually called “Late Antiquity,” around the years AD 400–500. Note that even the dip between the Roman Maximum and this Late Antiquity peak had temperatures that equal or exceed that of the recent past, as did the dip in temperatures from the end of the Late Bronze Age peak to the Roman Maximum.
Still, we must persevere and go back even further, this time to about 11,000 BC, shown in Figure 7. Now the last Ice Age clearly comes into view, a cold period that ended about 10,000 BC. There are several other peaks prior to the Late Bronze Age, but now the record makes the peaks and dips from about 8000 BC to the present look like noise on top of a much larger signal.
record and other annotations
with recent instrumental record added
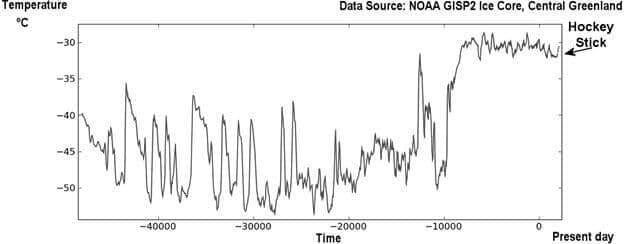
We are not yet at the end of our quest. We now go back about fifty thousand years, shown in Figure 8. From this graph it is clear that the latter days, that is, the past twelve thousand years, have been abnormally warm. Much cooler temperatures appear to be the norm, with much greater variability. Note that the last Ice Age, with its great glacial ice sheets, was a maximum about twenty thousand years ago.
with recent instrumental record added
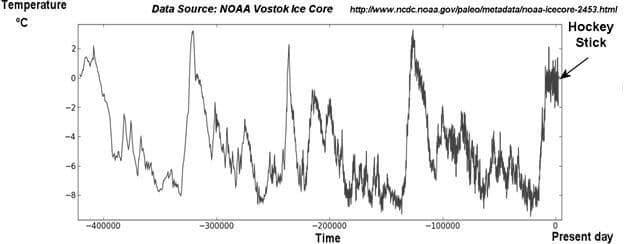
Still, this is not the best we can do. We shall go back now 450,000 years, shown in Figure 9 (page 54). From this vantage point, it is quite clear that there is a distinct cyclical pattern to the earth’s temperature, with a period of about 100,000 years, in which there is a sharp rise in temperatures to roughly current levels, followed quickly by a rapid decline. What is especially interesting is the relatively short time these peaks persist, only to be followed by some type of ice age.

with recent instrumental record added
*** The problem is that, while the ice core data show temperature changes, it can be difficult to peg the absolute temperature they show. Thus joining modern instrument records to ice core data (or other proxies) can result in different graphs, depending on the researcher’s method.
Correlations
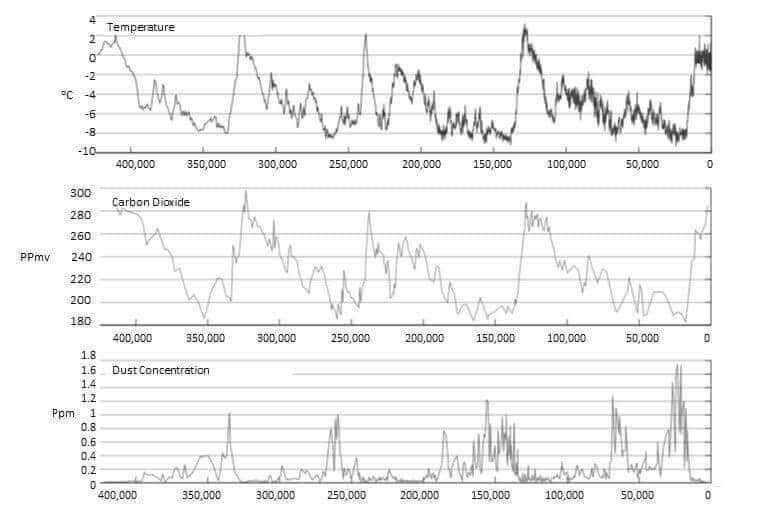
If one plots CO2 and dust level graphs on the same time scale as that of Figure 9, the interesting result shown in Figure 10 (page 54) emerges. Note that there is a close correlation between CO2 levels, global temperature, and dust levels; and even if one shifts the current temperature history up a few degrees, it makes no difference with respect to the overall picture. It is obvious, of course, that the production of CO2 on these time scales is not the result of human activity, and in fact it appears that in some way the increase in CO2 levels is not a cause, but an effect of the warming, though there may be a feedback relationship. This is because there is an eight-hundred-year lag in the CO2 level compared to the temperature level.14 One inference is that increased biomass activity due to higher temperatures yields higher CO2 levels. The reason for the dust correlation is not as clear. The peaks in the dust levels appear to coincide with dips in the temperature and CO2 levels.
450,000 years based on ice core samples
The clearly cyclical nature of the temperature and CO2 levels, and especially the sharp peak and saw-tooth shape in both, suggests that the CO2 may be related to temperatures via a feedback path that increases both. A warming trend may result in increased biological activity, which produces more CO2, and that in turn speeds up the warming somewhat, in a positive feedback loop, accounting for the very steep rise in temperature. But when the CO2 or the temperature level reaches a certain threshold, it triggers an effect leading to global cooling. Such an effect could be significantly increased cloud cover, for example, increasing the albedo (reflectivity) of the earth. The earth would then slowly cool, until the effect dissipated, and then the cycle would repeat. What the graph shows could easily be this type of feedback mechanism, although there could be other causes, such as long-term solar cycles. James Hansen, a prominent global warming advocate, has sought to link this long-term behavior with Milankovitch cycles, which are long-term cycles in the earth’s orbit (eccentricity, obliquity, and precession). At present it remains unresolved.
Looking Forward: The IPCC and the GCMs
The IPCC report (the latest is the fourth, 2007, available publicly on the Internet) collects a large amount of data on climate change, including temperatures in the atmosphere, on land masses, and in the oceans, salinization levels, sea level changes, greenhouse gas levels, snow cover, and other factors related to climate change. The IPCC reviews these with respect to causality and the likelihood and extent of anthropogenic influences. The analysis the IPCC has done is certainly impressive, and it cannot be dismissed easily. The reader is encouraged to download and peruse the report to get a better feel for the depth of the data collection and analysis. Even critics of the IPCC’s conclusions admit that the scientists who support the IPCC work have summarized well the scientific evidence for global warming and many of the uncertainties surrounding climate change, and have recognized that climate change is the result of forcing functions (or causes) on one hand, and feedback functions on the other. (The critics disagree about the nature and direction of the feedback.) The large number of trends that seem to be moving in the same direction naturally elicits the question, “What is the forcing function behind these trends?” The obvious answer is “human activity,” and then the inference is greenhouse gas production. Anyone who disputes this answer is justifiably confronted with the question, “What else is there?” An answer such as “natural processes” is not particularly interesting, nor does it lend itself to remedial action. This does not mean that it is not correct, however.
The hockey stick and similar graphs are useful for revealing temperature trends up to the present, but policymakers are more interested in future trends, in causation, and in possible mitigation strategies. For this it is possible simply to extrapolate the trends, though the variability of the data, as well as the controversy and uncertainty surrounding that data, make such extrapolation very problematic and not particularly convincing. Instead, various computer-based climate models, the GCMs mentioned earlier, are intended to model the world’s climate in such a way that reliable extrapolations into the future can be made under various strategies.
There are two types of mathematical/simulation models that can be devised: micro and macro. Micro-level models look at all the individual pieces, write code to simulate or model them, then try to describe all their interactions, and thus characterize the behavior of the complete system. It would be like simulating a city economy by modeling each type of shop, industry, and household; then transportation, banking, law, and government; and finally the dynamics connecting all these. Macro-level modeling looks at major flows from a high level and eschews details, assuming that they cannot be accurately modeled or that the details are not important. In the case of a city, the macro-level models would look at inputs and outputs (goods and services), money flows, and similar trends.
Climate modeling can be done either way, but the GCMs in development around the world have chosen the micro path, for which, understandably, the calculations needed are enormous, so these models must run on supercomputers. Macro-level models can run on PCs. GCMs take into account patterns of air flow, atmospheric gases, heating and cooling of large land and sea masses, and numerous other things, and seek to model climate “from the ground up”; that is, by modeling as many inputs and features of the earth’s climate as possible along with their interactions. This is perfectly fine, if all important variables are included and their dynamics (which may be quite complex) are accurately formulated.
In order to get the apparent rise in global temperature seen over the last century, and especially the recent sharp increase, all the GCMs assume that the earth’s climate is sensitive; that is, that any forcing will be amplified by positive feedback mechanisms. Thus any warming (forcing) due to long-term increases in man-made gases will result in higher temperatures than the raw forcing value suggests. Amplification is provided by clouds, ocean currents, and other elements of the earth’s climate system interacting with CO2 and other greenhouse gases in the atmosphere. Positive feedback is needed to account for the temperature increases over the past fifty years, and especially the rapid increase in temperature indicated by the hockey stick.
A positive feedback loop may result in a runaway situation at some point, perhaps similar to the greenhouse effect postulated for the atmosphere of Venus15 (though the concentration of CO2 in Venus’s atmosphere is 230,000 times that of the earth, and no one at present is predicting such a condition on the earth). Not everyone accepts these dynamics; critics contend that the feedback is net negative, reducing the impact of the climate forcing. Clearly a long pause in the warming of the earth, or still worse, a decline, would call the positive-feedback models into question. On the other hand, continued warming would corroborate the positive feedback assumption and the GCMs.
The major weakness of any modeling effort such as this is the limited amount of time for which we have accurate, directly measured data, contrasted with the known long cycles in the earth’s climate. This makes it difficult to determine functional relations accurately and to verify model behavior over long time spans by retrodiction, that is, by reproducing earlier temperature history. Clearly, any inaccuracies in past temperature reconstructions will impact the structure of the climate models in important ways, especially if the models are formulated to generate the spurious trends. It is hard to refrain from drawing a parallel with stock market forecasting: one could collect all manner of economic, political, and other data over a period of a month, look for trends, and then set out to model the data and forecast the future. The likelihood of success in the long term, however, would be rather small.
Presumably as a result of this, the IPCC is somewhat circumspect in its pronouncements. The widely quoted claim from the Fourth Assessment Report is not phrased as absolute: “Most of the observed increase in global-average temperatures since the mid-20th Century is very likely due to the observed increase in anthropogenic greenhouse gas concentrations.” The IPCC report goes on to claim that “discernible human influences now extend to other aspects of climate, including ocean warming, continental-average temperatures, temperature extremes and wind patterns.” They also argue that natural variability is not sufficient:
The observed widespread warming of the atmosphere and ocean, together with ice mass loss, support the conclusion that it is extremely unlikely that global climate change of the past 50 years can be explained without external forcing, and very likely that it is not due to known natural causes alone.16
The IPCC defines its terms with respect to probability ranges as follows: extremely likely >95%; very likely >90%; likely >66%.17 The IPCC projects future temperature ranges and, assuming a doubling of CO2 concentrations over the next century or so, concludes that the global average temperature increase “is likely to be in the range 2°C to 4.5°C with a best estimate of about 3°C, and is very unlikely to be less than 1.5°C. Values substantially higher than 4.5°C cannot be excluded.”18 The assessment specifically projects an increase of 0.2°C per decade for the next two decades (to 2027) and claims that even if greenhouse gas emissions had been held at year 2000 levels, there would still be an increase of 0.1°C per decade. This is a significant increase, larger than the recent increase (0.07°C per decade over the twentieth century, 0.13oC over the past thirty years), which would affect glacial melting, agriculture, ocean currents and salinization, and many other climate elements, most in a negative way with respect to human interests. The IPCC does admit that there are large uncertainties regarding clouds and their effect,19 and indeed a change in average cloud cover of 3% (resulting in a change in albedo of about 0.01) could account for warming or cooling of the magnitude seen in the twentieth century.****
The fact that there has been essentially no warming since about the year 2000, despite the continual dumping of large amounts of CO2 into the atmosphere, is causing consternation among supporters of the IPCC and the global warming hypothesis. James Lovelock, British environmentalist and originator of the “Gaia” theory of the earth as a single, integrated organism, has recanted: “There’s nothing much really happening yet. We were supposed to be halfway toward a frying world now. The world has not warmed up very much since the millennium. Twelve years is a reasonable time. The temperature has stayed almost constant, whereas it should have been rising. Carbon dioxide is rising, no question about that.”20
The IPCC’s credibility has been damaged by several errors in this report. First, the IPCC had to issue a retraction owing to incorrect statements about the melting of Himalayan ice. Then it emerged that the report contained claims about disappearing mountain ice that were based on a student dissertation and an article in a mountaineering magazine. A diagram intended to show the potential for generating electricity from wave motion was found to contain errors.21 The report also relied on papers by the World Wildlife Foundation (an advocacy organization) for its claims that global warming could kill off 40% of the rain forest. The IPCC argues, with some justification, that the errors do not affect the substance of the report; but when a highly controversial subject is under discussion, credibility is easily damaged by gaffes such as these. More serious is the loss of credibility due to backpedaling on the hockey stick—a case where the IPCC uncritically accepted a crucial piece of evidence.
**** Some estimates of the effect of albedo put its forcing much higher.
Answers to the Questions
We may now review the questions asked at the beginning of this study and see what answers make sense:
- Has there been recent warming (fifty years, one hundred years, etc.)? Yes, the instrumental record indicates a warming trend, especially over the past thirty years.
- Is this trend unusual in context of historical global temperatures (tens, hundreds of thousands of years)? That is, does it represent an anomaly? This is a more difficult question. Clearly, on the scale of hundreds of thousands of years, the recent temperature rise is little more than noise and in that context cannot be regarded as an anomaly, with or without the hockey stick. That does not mean that it is insignificant, however, since changes over long periods have wrought major ice ages, when large parts of the earth were covered with thick ice sheets. Warming is of course the opposite effect, but its continuation over a long period could also result in major climatic changes, including sea level rise together with concomitant flooding, as well as significant changes in growth patterns for flora and fauna over large areas. This is true regardless of the validity of the hockey stick and is the reason many are alarmed by the recent trends.
- How good are the data on which predictions (pro and con) are based? Recent data (past one hundred years or so) are rather solid, since they are direct instrument measurements. Earlier data is less well established because of the difficulty of associating actual temperatures with proxies. The ice cores appear to be fairly reliable; tree rings can be more problematic as temperature indicators, because they depend on factors other than temperature (e.g., CO2 levels, moisture). More research on this is clearly needed, and long-term data from more global locations is also necessary to put to rest questions about the hockey stick. On the other hand, there is other evidence of warming in the form of sea level changes, reductions in glacial ice sheets, and snow cover decreases, among others (though many of these phenomena have been observed in the past).
- What are the known or suspected correlations with temperature change (solar activity, human activity, etc.)? Clearly human activity is suspected with regard to the recent increase in global temperatures (since 1980). There is a suspected correlation with solar activity over a longer term (about four hundred years), although that cannot account for the recent run-up, and our data about solar irradiance do not go back far enough to establish the presence or absence of a connection between solar activity and global temperatures. There definitely is, however, a correlation of solar activity with temperatures at least in Europe: during the Little Ice Age, solar activity, as measured by sunspots, was sharply down, though how much that changed insolation (solar energy impinging on the earth) is not clear. GCMs generally assume a variation of 0.1% in solar output (corresponding to 1.3 watts/square meter forcing); variations much larger than that would exceed the effect of greenhouse gases. The Earthshine project has measured changes in the earth’s albedo up to about 9 watts/square meter—several times the total forcing of greenhouse gases. The GCMs do not consider such large changes in albedo. Albedo is largely a function of cloud cover, an acknowledged area of uncertainty in the IPCC assessment, and albedo changes are strongly correlated with recent temperature trends. Ocean current trends such as the Pacific decadal oscillation (PDO) are also strongly correlated with recent temperature records.
- What are the best available projections of future changes, and how reliable are they? This is a very difficult question, because the climate models that we have, the General Circulation Models, are based on limited data about processes that unfold over very long periods. In addition, as the answer to the last question indicates, we do not really understand all the causal influences on climate, or exactly how any one of them affects climate. The IPCC admits this but believes that we have enough data to construct reasonably accurate models, and that our understanding of key functional relationships among climate variables is robust. These models generally forecast a temperature increase of about 0.2oC for each of the next two decades (2010–20, 2020–30). If these forecasts are accurate, the models (and the underlying theory) will be corroborated; if they are not, we may be back to the drawing board. Forecasts of global temperature increases have not been met in recent years, as noted above.
- What percent of recent warming can reasonably be attributed to human activity? The answer appears to be “some,” but we cannot say definitively how much. It depends, partly, on how much confidence one places in the hockey stick graph. Various other explanations have been given, including the Pacific Decadal Oscillation,22 solar activity, and changes in the earth’s albedo.23 A cautionary estimate of 50% seems reasonable, provided that one acknowledges that the actual number could be anywhere from 5% to 95%, and that it may be decades before we have enough empirical data for an accurate estimate.
- How much of this human activity is associated with use of carbon-based fuels? The exact answer to the question is not known, but is probably in the 50–90% range. Any human activity that uses energy not from the sun generates heat. Obviously, burning virtually any fossil fuel in the atmosphere involves production of CO2 (although wood burning is carbon-neutral because trees use CO2 to make wood, so whether a tree is burned for fuel or just decomposes after it dies, the same amount of CO2 is released but later absorbed by new trees). Other human activity is known to produce greenhouse gases, including cultivation of rice in paddies (which behave similarly to wetlands in the production of methane), raising of farm animals that produce methane in the process of digestion (mainly cattle), emissions from landfills, and natural gas leaks.24
- What realistically can be done to curb this activity? There are two conflicting problems: (1) We don’t want to spend trillions of dollars on something that might be totally ineffectual; (2) If we don’t do something now, it may be too late, with catastrophic global flooding, extreme weather, and steadily increasing heat. Erring on the side of caution is generally a good idea, although there is a high opportunity cost in this case—lost jobs, reduced productivity, even starvation; the burden, as usual, would fall unequally on the poor. The Kyoto protocol expires in 2012, and no replacement treaty is in place. The next ten years or so should tell the tale: if there is no significant warming, or even cooling, the credibility of the IPCC will be destroyed. If warming resumes, its credibility will be significantly enhanced.
Where We Stand Now
The earth’s climate is always changing, and climate research seeks to understand it by looking back to past events and trends, and forward by modeling the climate and projecting future trends. Not in dispute are (1) the recent high rate of temperature increase; (2) the increase in atmospheric CO2 and other greenhouse gases; (3) the responsibility of human activity for increases in greenhouse gases; (4) the climate forcing of CO2 and other greenhouse gases; and (5) the existence of positive and negative feedbacks in the earth’s climate system. What is in dispute is explanation of the temperature rise, the nature of the feedbacks in the climate system, and future temperature projections. The prevailing position is that of the IPCC, that the warming is unprecedented and must be the result of climate forcing from human-originated greenhouse gas emissions, amplified by feedback in the earth’s climate system. The primary remedy is curtailment of these emissions. Critics claim that the feedback on balance is negative, reducing the impact of greenhouse gas emissions.
Since the world consumes about ten trillion tons of fossil fuels annually (coal, oil, natural gas), a great deal of CO2 is produced, along with various airborne pollutants. This level of consumption is undesirable for several reasons that have nothing to do with global warming: (1) we need to husband resources for future generations—the supply of fossil fuels is not unlimited (sustainability); (2) use of fuels imported from unstable regions of the world leaves us vulnerable to geopolitical events that could interrupt our supply; and (3) we should seek to reduce pollution, and burning of many types of fossil fuel leads to relatively high pollution levels. This means that the question of fossil fuel use and conservation should be decoupled from that of global warming. The ideal solution would be to fund alternative energy research to find alternative heat and carbon-neutral ways of generating power.
At this time the Climategate scandal and problems with the hockey stick graph have adversely affected the credibility of global warming advocates (though not necessarily their scientific case). The global recession that began in 2008 has effectively killed serious global efforts at CO2 mitigation. As for future action, opinion polls on the subject of global warming vary considerably and depend on the particular questions asked; the percent of the population that believes global warming is happening or is a threat ranges from 30 to 70,25, 26 with a recent Yale poll putting the number at 60%, at least in the United States.27 A Nature Conservancy poll from 2008 disclosed that only 18% of respondents thought that global warming was real, harmful, and due to human activity.28 These numbers are very inconsistent, which suggests that support is below the threshold needed for sustained, aggressive political action.
The subject of climate change has become the focus of much attention because of the prestige of the IPCC and its predictions of significant future temperature increases if CO2 production is not curtailed. The controversy has assumed a religious nature, in part because of biblical passages interpreted as enjoining environmental stewardship on mankind, and because for some environmentalism has become a surrogate religion: “We are going to destroy the creation,” James Hansen has warned us.29 Indeed, both sides are claiming the moral high ground: those aligned with the IPCC contend that our failure to curtail greenhouse gas production will result in a catastrophe for the earth and humanity; those opposed argue that there will be a catastrophe, but of a different sort, especially for the poor, if the gas abatement proceeds. In light of this situation, there are three basic positions that a rational observer may take:
1. Worldwide action to reduce fossil fuel use should be taken immediately. To many, including the IPCC, historical trends and climate models strongly indicate that there will be catastrophe on a global scale, including flooding, famine, property destruction, and reductions in the habitability of the earth unless CO2 emissions are sharply curtailed, which means a significant drop in fossil fuel use. Abatement, for them, is the only prudent course.
2. No significant reduction in fossil fuel use is needed. Others dispute the notion of global warming on account of (a) disagreement about temperature reconstructions for the past and thus about the seriousness of the recent rise; (b) disagreement about the validity of the GCMs and in particular about the sensitivity of the climate system with respect to greenhouse gas forcing (negative vs. positive feedback); and (c) the large sums of money and the economic and social dislocations necessary for any effective mitigation strategy, including the degree of coercion that would be required. This implies that unwarranted actions to reduce CO2 by reducing fossil fuel consumption will itself lead to catastrophe, including starvation and significantly reduced living standards, especially for the poor, since the richer countries will be able to afford the higher prices for food, energy, and other goods stemming from greenhouse gas abatement efforts.
3. Suspend judgment. The relatively short period of time over which we have reliable measurements means that climate modeling and thus forecasting is difficult; hence the degree of certainty needed for difficult and possibly irreversible political changes is lacking. The next ten years will give us much more information about the earth’s climate and, in particular, about temperature trends. Most likely we shall have to wait that long before there is any certainty one way or the other regarding the effect of CO2 and thus the need for a mitigation strategy. So a wait-and-see attitude for now is the best course. This course of action is not without risk, however, because global warming could escalate, rendering mitigation far more difficult.
The old Chinese curse seems appropriate here, “May you live in interesting times!” We do, thanks in part to the global warming controversy. The next decade or so will tell the tale: either science (or at least establishment science) will enjoy one of its greatest triumphs and save humanity or suffer its most embarrassing and humiliating failure. ♦
Thomas B. Fowler is adjunct professor of engineering at George Mason University and a retired systems engineer. His doctorate is in systems and control theory from George Washington University.
1 Al Gore, An Inconvenient Truth: The Crisis of Global Warming (New York: Viking, 2007—also a well-known video); Earth in the Balance: Forging a New Common Purpose (London: Earthscan, 2007); James Hansen, Storms of My Grandchildren: The Truth About the Coming Climate Catastrophe and the Last Chance to Save Humanity (New York: Bloomsbury, 2009).
2 Letters to the Editor, University of Chicago Magazine (January–February 2012), 6.
3 J. Farmer and M. Baxter, “Atmospheric carbon dioxide levels as indicated by the stable isotope record in wood,” Nature 247 (February 1974): 273–275; NOAA Earth Research Laboratory, “Recent Mauna Loa CO2,” http://www.esrl.noaa.gov/gmd/ccgg/trends/. Article “Air,” from Encyclopedia Britannica, http://www.britannica.com/EBchecked/topic/10582/air.
4 Intergovernmental Panel on Climate Change History, IPCC web page, http://www.ipcc.ch/organization/organization_history.shtml#.T5agnNmQOeY.
5 M. Mann, R. Bradley, and M. Hughes, “Global-scale temperature patterns and climate forcing over the past six centuries,” Nature 392 (1998): 779–87.
6 M. Mann, R. Bradley, and M. Hughes, “Northern Hemisphere Temperatures during the Past Millenium: Inferences, Uncertainties, and Limitations,” Geophysical Research Letters 26, no. 6: 759–62.
7 C. Woodhouse, D. Meko, G. MacDonald, D. Stahle, E. Cook, “A 1,200-year perspective of 21st century drought in southwestern North America,” Proc. National Academy of Sciences 50 (December 14, 2010): 21283–88, http://www.pnas.org/content/early/2010/12/06/0911197107.full.pdf+html.
8 Fred Pearce, “Hockey Stick Graph Took Pride of Place in IPCC Report, Despite Doubts,” Guardian Special Investigation, February 9, 2010, http://www.guardian.co.uk/environment/2010/feb/09/hockey-stick-graph-ipcc-report.
9 Roy Spencer, The Great Global Warming Blunder (New York: Encounter Books, 2010), 11.
10 A. W. Montford, private communication to the author.
11 G. North et al., Surface Temperature Reconstructions for the Last 2000 Years (Washington, DC: National Academies Press, 2006).
12 A. W. Montford, The Hockey Stick Illusion (London: Stacey International, 2010), 402–20.
13 Intergovernmental Panel on Climate Change, Climate Change 2007: The Physical Science Basis (New York: Cambridge University Press, 2007), Figure TS. 20, p. 55. The figure shows twelve different reconstructions of northern hemisphere temperatures, most of which show some medieval warming and some subsequent cooling. But all show that current temperatures are significantly higher than in the medieval period, by 0.5oC or more.
14 Spencer, Great Global Warming Blunder, 29.
15 European Space Agency, “ESA Venus Express,” http://www.esa.int/esaMI/Venus_Express/SEMFPY808BE_0.html.
16 Ibid., 10.
17 Intergovernmental Panel on Climate Change, Climate Change 2007: Synthesis Report, Geneva, Switzerland, 27, http://www.ipcc.ch/publications_and_data/ar4/syr/en/contents.html.
18 Ibid., 12.
19 Intergovernmental Panel on Climate Change, Climate Change 2007: The Physical Science Basis (New York: Cambridge University Press, 2007), 88.
20 “Climate Change Alarmist Recants: ‘I Made a Mistake,’” report from MSNBC, reported in Newsmax, www.newsmax.com, April, 29, 2012.
21 R. Gray and B. Leach, “New errors in IPCC climate change report,” Telegraph, February 6, 2010, http://www.telegraph.co.uk/earth/environment/climatechange/7177230/New-errors-in-IPCC-climate-change-report.html.
22 Spencer, Great Global Warming Blunder, 14.
23 Project Earthshine; see comments on forcings due to albedo and greenhouse gases, “Earth’s Albedo Tells an Interesting Story,” http://current.com/1gabu4c.
24 J. Miralda-Escudé, “The anthropogenic greenhouse effect: radiative forcings,” Institute of Space Sciences, Bellaterra, Spain, http://www.ice.csic.es/personal/miralda/fsgw/lect3.html.
25 Gray and Leach, “New errors in IPCC climate change report.”
26 J. Eilperin, “Fewer Americans believe in global warming, poll shows,” Washington Post, November 25, 2009, http://www.washingtonpost.com/wp-dyn/content/article/2009/11/24/AR2009112402989.html.
27 S. Pappas, “New poll shows 63 percent of Americans believe global warming is occurring,” LiveScience, http://www.mnn.com/earth-matters/climate-weather/stories/new-poll-shows-63-percent-of-americans-believe-global-warming-.
28 “What Do Americans Believe About Climate Change?” Nature Conservancy, October, 2008, www.nature.org/initiatives/climatechange/features/art26253.html.
29 S. Rothschild, “NASA Climate Expert Warns Kansans of Dire Consequences of Global Warming,” Lawrence Journal-World, September 23, 2008.
NOTE: Some of the data shown in the figures are updated monthly by the sources. Readers who desire updated, larger, color versions of all the figures in this article should contact the author directly: tbfowler@gwu.edu.
Get the Collegiate Experience You Hunger For
Your time at college is too important to get a shallow education in which viewpoints are shut out and rigorous discussion is shut down.
Explore intellectual conservatism
Join a vibrant community of students and scholars
Defend your principles
Join the ISI community. Membership is free.
You might also like
The Danger of Philosophy
In the wrong hands, it can easily lead to endless and perverse questioning of everything.
Was the Constitution a Coup?
H. W. Brands attempts to uncover the causes of the founding debates.